
A team of U of T researchers has an innovative way to use existing Street View images to reveal what’s inside structures.
Did you ever wonder how a building was constructed? Or perhaps if it has a recently renovated interior and is now more energy efficient? How would you know unless you had the opportunity to view it during a realtor’s open house?
Researchers at U of T have created a way to use Google Maps Street View images to assess existing structures. With the aid of machine learning, commonly known as artificial intelligence (AI), the images available online can be used to generate data to help determine the age, height and size for existing structures. Known fully as Image-based prediction of residential building attributes with deep learning, the system shows promise for future, widespread uses.
Why is this useful?
Planning for existing and future infrastructure needs, such as water, sewage, power, transportation and more, and understanding the resources consumed in building neighbourhoods is critical for towns and cities. Generating the kind of data needed is tremendously expensive and difficult to obtain.
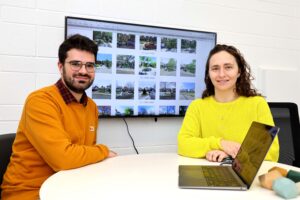
Professor Shoshanna Saxe in the Department of Civil & Mineral Engineering (CivMin), Alex Olson (MIE MASc 2T0), a senior AI researcher at the Centre for Analytics and Artificial Intelligence Engineering (CARTE), along with first author Weimin Huang (MIE MASc student) and Prof. Elias Khalil (MIE)have developed the new system with an astounding overall 80 per cent accuracy.
Summing up the system they’ve developed, Saxe says, “This is the first paper we know of where people took a picture that shows you the front of the building and then predicts things that you can’t see in the picture.”
As Streetview is prevalent nearly everywhere, this cost-effective way to generate significant building data has the potential to assist in planning for infrastructure needs all over the world. “My motivations were very focused on embodied carbon research use, but this will be useful for lots of different people. I’ve talked to researchers who are looking at understanding water usage for future planning, or resilience assessments. There’s a lot of places where there’s just not reliable data. Having methods that can let us understand neighbourhoods and buildings at scale is really useful,” Saxe explains.
Illustrating just how cost-effective the method is, Saxe says” We spent maybe $1,000 on photos to get data that would otherwise cost millions of dollars to obtain. Nobody has millions of dollars to spend on just building dimensions, so this is the difference between being able to work on these problems and not.”
“Being able to assess the exteriors allows a sort of educated guess at the interiors and the kinds of uses the occupants put on local infrastructure,” Olson says. “It gives a strong estimate of the resources used in building, maintaining and operating the buildings.”
Saxe expands, “This is information you can’t get from traditional methods of just looking at maps or plans – you need to see structures. One of the distinctions is we’re predicting what the internal square footage of the building is. And, although obviously that tracks with the size of the outside of the building, it’s actually harder to predict. And you also can’t see how old the building is from the outside.”
“If you have experience, you can walk around and say, that building looks about this old to me, this building looks about that old to me and so on. But there’s all kinds of things about it that make it hard, including renovations. The front can be different from the back. And is the frontage brick, glass or is it concrete? Knowing the age of the building is important, as it tells you what materials were used and what embodied carbon there is. And, also, how it performs.”
One of the challenges they faced in their research was the way buildings change over time with both minor and major renovations. Deciding what constitutes a major change is often open for debate and interpretation. At what point is the structure no longer the original one? The “Ship of Theseus” paradox addresses this kind of change over time. Essentially, when is the ship no longer the original ship? At what point is a renovation so extensive that you are functionally dealing with a new building?
This popped up interesting challenges for the model. One example of a home in the study, 49 Nanton Avenue, is one that was completely gutted and renovated, but had an exterior much like its original. In the original data used for training the model 49 Nanton had been categorized as a new building based on the gut renovation. But looking at the Streetview image it was assessed by the model as an old 1910 or 1920 building.
The ability to see beyond the facades of buildings with this AI could help us better understand the resource needs of our cities and with prioritizing future infrastructure in areas of greatest need. Olson reflects,“You want to understand where there’s underused resources or infrastructure in your city. It sounds like we should already have the data, but we really don’t. With this, while it doesn’t model the future, it does quite accurately describe what the current situation is and allows us to use the data for planning our resource uses and what we want to do in the future.”